Introduction
This tutorial shows how to set up SEM for a basic run and how to change the parameter values.
Set Up
Import and format the meteorological inputs.
# Define the path to the netcdf file containing the meteorology inputs.
nc_path <- system.file('extdata/AMF_USMe2_2005_L2_GF_V006.nc', package = 'PestED')

# Format the inputs into the SEM required format.
met_inputs <- format_inputs(nc_path)
Basic Run
Now that the inputs are set up let’s run SEM.
baseline <- iterate.SEM(pest = c(0, 0, 0, 0, 0), #  Disturb none of the carbon pools.
            inputs = met_inputs, # Read in the met inputs.
            params = PestED::default_parameters, # the list of default parameters is saved as package data.
            years = .5) # the number of years to run SEM for.
baseline$index <- 1:nrow(baseline) # add a time inndex to the results
Let’s take a quick look at the results.
plot(baseline$GPP, ylab = 'GPP', main = 'Baseline SEM', type = 'l')
Change Parameter Value
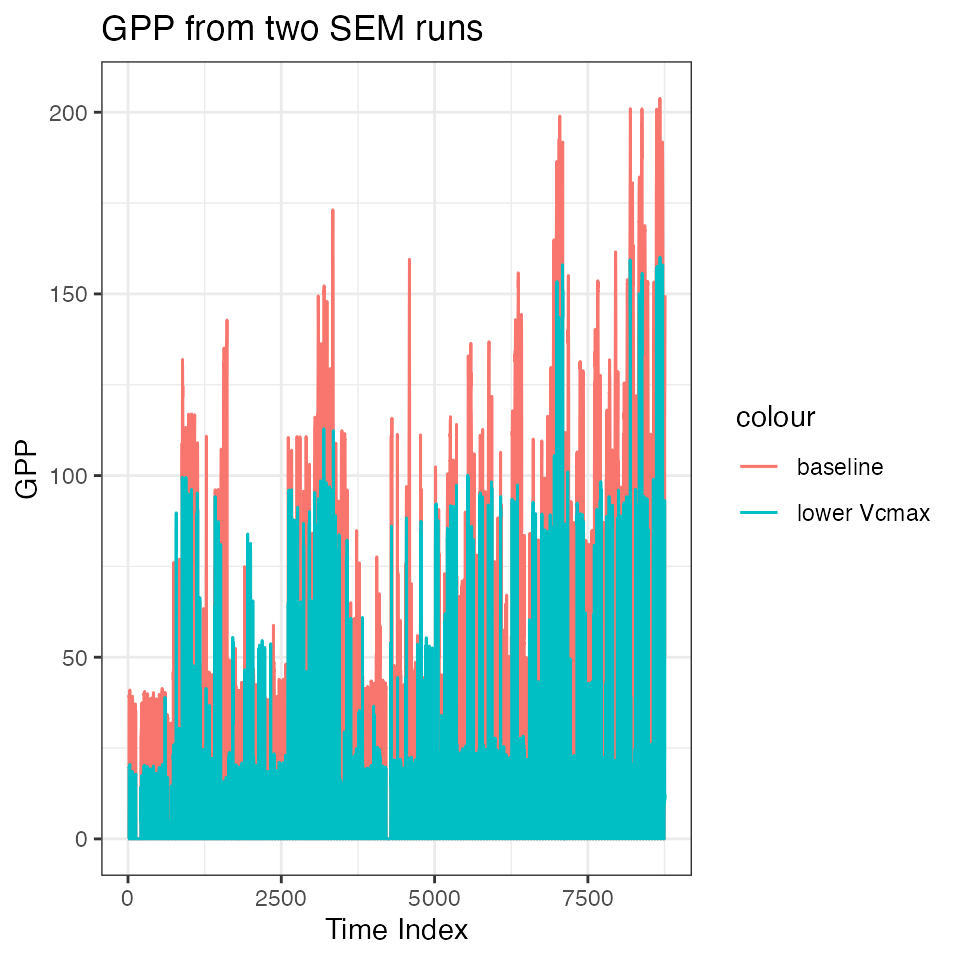
What happens when we divide Vcmax in half?
# Save a copy of the default parameter values.
new_params <- PestED::default_parameters

# Alter the Vcmax value.
new_params$Vcmax <- PestED::default_parameters$Vcmax / 2
Solve SEM with the new parameter value.
run2 <- iterate.SEM(pest = c(0, 0, 0, 0, 0), #  Disturb none of the carbon pools.
            inputs = met_inputs, # Read in the met inputs.
            params = new_params, # the list of default parameters is saved as package data.
            years = .5) # the number of years to run SEM for.
run2$index <- 1:nrow(run2) # add a time inndex to the results, to do is to add actual time inforamtion.
Compare the GPP of the two runs.
ggplot() +
  geom_line(data = baseline, aes(index, GPP, color = 'baseline')) +
    geom_line(data = run2, aes(index, GPP, color = 'lower Vcmax')) +
  theme_bw() +
  labs(title = 'GPP from two SEM runs',
       x = 'Time Index',
       y = 'GPP')